The 15 ED charts per hour benchmark dates from 2012 and ICD-9. Where ED productivity figures come from, what 95% accuracy measures, and how to cost a coded chart.
Most medical coder productivity benchmarks quoted for emergency department work trace back to one number: 15 ED encounters per hour, published by AHIMA in 2012. That figure predates ICD-10-CM, predates the 2023 rewrite of ED evaluation and management (E/M) guidelines, and was never a measured average. This article sets out where the ED benchmarks come from, what the accuracy target actually measures, and how to calculate cost per chart from public wage data, so you can set a standard for your own department instead of borrowing one. If you're scoping a wider change to the ED workflow, our ED coding automation guide covers the rule sources behind each ED code.
Where the published ED productivity benchmarks come from
The ED figure most often repeated comes from a 2012 Journal of AHIMA article on coding productivity by Kathryn DeVault, RHIA, CCS, CCS-P. It listed ED coding at 15 encounters per hour, or about 4 minutes per record, as an ICD-9-CM expectation. The same article said expectations should be adjusted for case mix, acuity, organizational complexity and work assignment.
| Setting | Records per hour | Minutes per record | Records per 8-hour day | Code set era |
|---|---|---|---|---|
| Emergency department | 15 | 4 | 120 | ICD-9-CM |
| Ambulatory surgery and interventional procedures | 5 | 12 | 40 | ICD-9-CM |
| Ancillary testing | 30 | 2 | 240 | ICD-9-CM |
| Inpatient | 3 | 20 | 24 | ICD-9-CM |
Source: DeVault, Journal of AHIMA, July 2012. These are planning expectations, not measured averages.
The inpatient row shows why the ED row needs caution. When AHIMA published a measured ICD-10 productivity study in 2016 (Watzlaf, Nemchik, Hoerner and Sheridan), coders across 157,248 inpatient records averaged 1.4 records per hour under ICD-10. That's 22% below the same coders' ICD-9 rate of 1.8, and 53% below the 3 per hour expectation on the table above.
We could not find an equivalent published post-ICD-10 study for ED charts. So the honest position is this: 15 per hour is an old expectation for a simpler code set, and the only setting that was remeasured came in at less than half its published standard.
Why ED charts per hour vary so widely
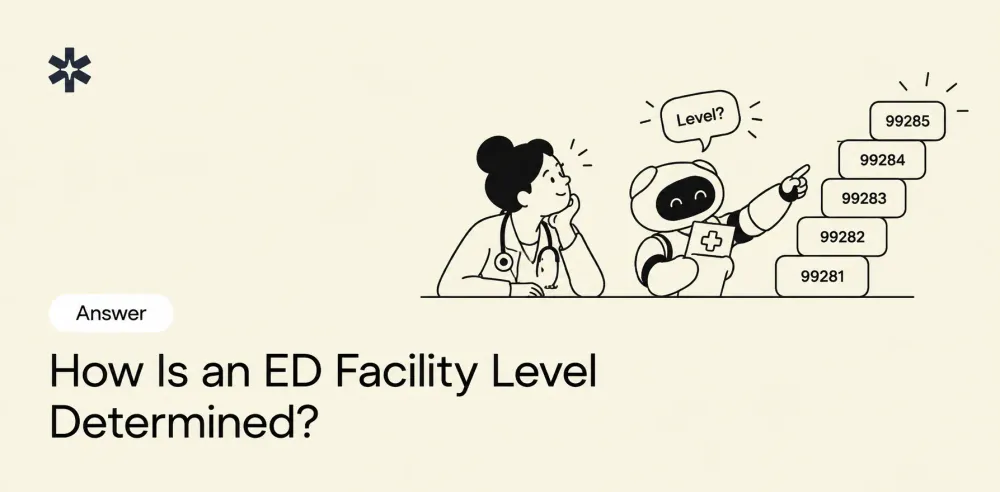
"ED coding" covers two different jobs on the same encounter. Professional fee coding assigns the physician's E/M level (99281 to 99285), diagnoses and any separately billable procedures. Facility coding assigns the hospital's visit level using the hospital's own criteria, plus procedures, injections, infusions and hydration, and frequently critical care. Our comparison of ED facility vs professional coding covers both workflows.
Since January 2023, the AMA has based professional ED E/M levels on medical decision making alone, with time no longer a factor for 99281 to 99285. That changed what a coder reads in the note, which is one more reason a 2012 number may not describe 2026 work. Our breakdown of how ED E/M levels are assigned walks through the three MDM elements.
Facility levels have no national standard. CMS lets each hospital set its own visit-level guidelines under the outpatient prospective payment system, so a facility chart in one health system is not the same unit of work as one in another.
What moves charts per hour inside your own department:
- Fee type. Facility charts with infusion start and stop times, hydration and procedures take longer than a pro-fee chart with an E/M level and two diagnoses.
- Acuity mix. A Level 5 chart with critical care (99291) and a CT read is not a Level 2 sprain. Report rates by level, not as one average.
- Documentation completeness. Each chart that needs a query to the provider leaves the coder's queue and comes back later. Count it once. Held charts are also a leading cause of ED coding backlogs and DNFB.
- EHR navigation. Coders who must open separate nursing, MAR and procedure tabs lose minutes per chart that no benchmark captures.
- Annual code updates. Expect a dip after each October 1 ICD-10-CM release; the FY2027 ICD-10-CM changes are the current example.
What "95 percent accuracy" means in ED coding
A 2019 For The Record review of coder performance describes 95% as the common industry compliance target, while noting that audit methods differ between facilities. That last clause carries most of the weight.
Ninety-five percent of what? Three ED audits can all report 95% and mean different things:
| Accuracy unit | What counts as correct | Typical ED failure it misses |
|---|---|---|
| Code level | Each code assigned matches the auditor's code | A correct code set with the wrong E/M level still scores well |
| E/M level agreement | Coder's 9928X level matches the auditor's | Missed procedures, modifier 25, diagnosis errors |
| Encounter level | Every code on the chart is correct | Nothing, but scores run much lower, so it's rarely reported |
Two practical rules for ED audits. First, report overcoding and undercoding separately, because netting them hides a compliance problem behind a revenue one. Second, state the unit, the sample size and the auditor's credential next to the percentage. Our defensible accuracy methodology covers sample sizes and reference standards in detail.
Productivity and accuracy have to be read together. A coder at 20 charts per hour with 90% E/M agreement is not more productive than one at 14 with 97%. The first one generates rework, denials and audit exposure that land on someone else's desk.
How to calculate cost per ED chart
Cost per chart is labor cost divided by charts coded. The inputs below come from the Bureau of Labor Statistics; the productive-time share is an assumption you should replace with your own.
- Medical records specialists earned a median of $59,120 a year in hospitals and $47,120 in physician offices in May 2025.
- Benefits made up 30.0% of private-industry compensation costs in June 2026, per the BLS Employer Costs for Employee Compensation release.
- We assume 85% of paid hours are spent coding, with the rest going to meetings, education, queries and system downtime.
Worked example, facility coder: $59,120 ÷ 2,080 hours = $28.42 wage per hour. Divide by 0.70 to add benefits: $40.60 loaded cost per paid hour. Divide by 0.85 for productive time: $47.77 per coding hour.
| Charts per productive hour | Facility coder cost per chart | Pro-fee coder cost per chart |
|---|---|---|
| 8 | $5.97 | $4.76 |
| 10 | $4.78 | $3.81 |
| 12 | $3.98 | $3.17 |
| 15 | $3.18 | $2.54 |
| 20 | $2.39 | $1.90 |
| 25 | $1.91 | $1.52 |
Pro-fee column uses the $47,120 physician-office median: $22.65 wage, $32.36 loaded, $38.07 per productive hour. Calculation by MEDIQCODE from BLS data; it is a model, not a survey of actual costs.
What this model leaves out matters as much as what's in it. It excludes QA auditor time, management overhead, encoder and EHR licensing, outsourcing premiums and the cost of denied claims. Add your QA sampling rate as a separate line: if an auditor re-reviews 5% of charts at three times the coding time, that adds roughly 15% to cost per chart.
The more useful number for a revenue cycle director is cost per correctly coded chart. Divide cost per chart by the encounter-level accuracy rate from your own audit, and the gap between a fast coder and an accurate one becomes a dollar figure. Vendor per-chart prices are a separate comparison; our overview of per-chart and subscription pricing explains why they rarely line up with an internal labor model.
How to set your own ED productivity standard
Borrowed benchmarks fail because the unit of work differs. A defensible ED standard takes four to six weeks of your own data.
- Split pro-fee and facility. Measure them as separate queues with separate standards.
- Time charts by acuity level. Pull 30 days of coder timestamps and report median minutes per chart for each level, plus critical care charts on their own.
- Exclude held charts from the clock. A chart waiting on a provider query isn't coder time.
- Audit the same coders in the same window. Use a credentialed auditor (CEDC or CPC with ED experience), blind to the original codes, on a stratified sample.
- Publish the standard as a pair. For example, a target rate per acuity band alongside a minimum E/M agreement rate. A rate without an accuracy floor rewards speed alone.
- Remeasure after every code set release and after any EHR template change.
If you plan to bring software into the workflow later, this baseline is the thing you'll measure it against, so capture it before any implementation timeline starts.
What AI-assisted coding changes in these numbers
Software that pre-populates codes changes the denominator more than the coder. If a share of low-acuity charts is released without human review, coders are left with a harder mix, and their charts per hour will fall even while total department throughput rises. Read any before-and-after productivity figure with that in mind, and ask how charts were routed. The trade-offs between direct-to-bill and coder-in-the-loop decide which number you should be tracking.
The same caution applies to accuracy. Vendor figures rarely state the unit, sample or auditor, and a realistic automation rate depends heavily on which encounters are counted as in scope. Hold any system to the same blind, credentialed audit you run on your own coders. MEDIQCODE is built around AI-assisted coding with human sign-off, and we'd expect to be measured that way too.
For coding managers, the staffing question follows directly: if the easy charts leave the queue, the remaining work needs more experienced coders, not fewer. We cover what happens to coding roles separately.
Frequently asked questions
How many ED charts should a coder code per hour?
The most cited published expectation is 15 ED encounters per hour, from a 2012 Journal of AHIMA article written for ICD-9-CM. We could not find a published post-ICD-10 ED study, and inpatient productivity fell well below its published standard when it was remeasured in 2016. Set your own standard by fee type and acuity level.
Is facility ED coding slower than professional fee coding?
Usually, yes. Facility charts carry the hospital's own visit-level criteria plus injections, infusions, hydration and procedures with time documentation, while a pro-fee chart centers on the physician's E/M level and diagnoses. Measure the two as separate queues.
What accuracy rate should ED coders meet?
95% is the commonly cited compliance target, but it is only meaningful when the unit is stated. Code-level accuracy, E/M level agreement and encounter-level accuracy produce very different numbers from the same audit. Report the unit, sample size and auditor credential with every rate.
How do you calculate cost per coded chart?
Divide the fully loaded labor cost per productive hour by charts coded per hour. Using May 2025 BLS hospital wages, a 30% benefits share and 85% productive time, a facility coder at 15 charts per hour costs about $3.18 per chart before QA, overhead and software.
This article is general education on coding operations. It is not a coding determination for any specific encounter. Code assignment depends on the documentation, current code sets and applicable payer policy.