Under V28, MA risk scores fell from 18% to 9% above Original Medicare. See which HCCs and populations lost the most, and where coding intensity still sits.
The CMS-HCC V28 changes are no longer a blend. From payment year 2026, CMS calculates 100 percent of Medicare Advantage risk scores with the 2024 CMS-HCC model, the version built on clinical classification V28. The CY 2027 Rate Announcement kept that model in place for another year.
That makes this the first period where the full effect of V28 shows up in actual payments rather than projections. The effect wasn't spread evenly. Some members, conditions and organizations lost a lot of risk adjustment factor (RAF) score. Others gained. This article covers what changed in the model, who lost RAF and why, and where coding intensity still sits now that V28 is the only model in play.
What V28 changed, in numbers
CMS rebuilt the hierarchical condition categories (HCCs) on ICD-10-CM, recalibrated them on newer data, and moved a large set of diagnosis codes out of payment. The CMS fact sheet for the CY 2024 Rate Announcement gives the counts:
| 2020 CMS-HCC model (V24) | 2024 CMS-HCC model (V28) | |
|---|---|---|
| Total HCCs | 204 | 266 |
| Payment HCCs | 86 | 115 |
| Non-payment HCCs | 118 | 151 |
| ICD-10-CM codes mapped to a payment HCC | 9,797 (13.3% of codes) | 7,770 (10.5% of codes) |
| Calibration data | 2014 diagnoses, 2015 expenditures | 2018 diagnoses, 2019 expenditures |
| Share of non-PACE MA risk score | 67% (2024), 33% (2025), 0% (2026) | 33% (2024), 67% (2025), 100% (2026 onward) |
About 2,236 codes that mapped to a payment HCC under V24 no longer do under V28. The phase-in schedule is set out on page 3 of the CY 2024 Rate Announcement.
Most removed codes weren't about upcoding
The common shorthand is that CMS "cut 2,000 codes to stop upcoding." The fact sheet says something narrower. Of the roughly 2,236 codes removed from payment, CMS attributes just 75 to discretionary coding variation. The rest, about 97 percent, came from reclassifying the model on ICD-10 and recalibrating it.
That matters for how you read your own losses. A code that dropped out because of reclassification doesn't signal that your coders did anything wrong. A code removed for discretionary variation is CMS saying the diagnosis was coded too inconsistently to predict cost reliably. Those 75 codes are where coding behavior, not just the model, was in CMS's sights.
The structural changes that move RAF
Four mechanics explain almost every RAF change a coding team sees when it compares a member under V24 and V28.
1. Codes with no payment HCC. A diagnosis can be accurate, specific and fully supported, and still contribute nothing to the score. Coders should still assign it. Clinical accuracy, quality measures and the next model recalibration all depend on complete coding. It just doesn't pay under V28.
2. Constrained HCCs. In some families, V28 sets related HCCs to the same coefficient. The best-known example is diabetes: the three diabetes HCCs now carry equal weight, so coding diabetes with chronic complications no longer earns more than diabetes without them. Specificity still matters for audit consistency. It just stopped changing the payment.
3. Finer splits. More payment HCCs means CMS divided some broad categories into narrower ones with different weights. A member who sat in one V24 category may land in a lower-weighted V28 category for the same condition.
4. Hierarchies and interactions. Only the most severe HCC in a family counts, and some V24 interaction terms changed or disappeared. A member's net change can be negative even when every individual diagnosis is still coded.
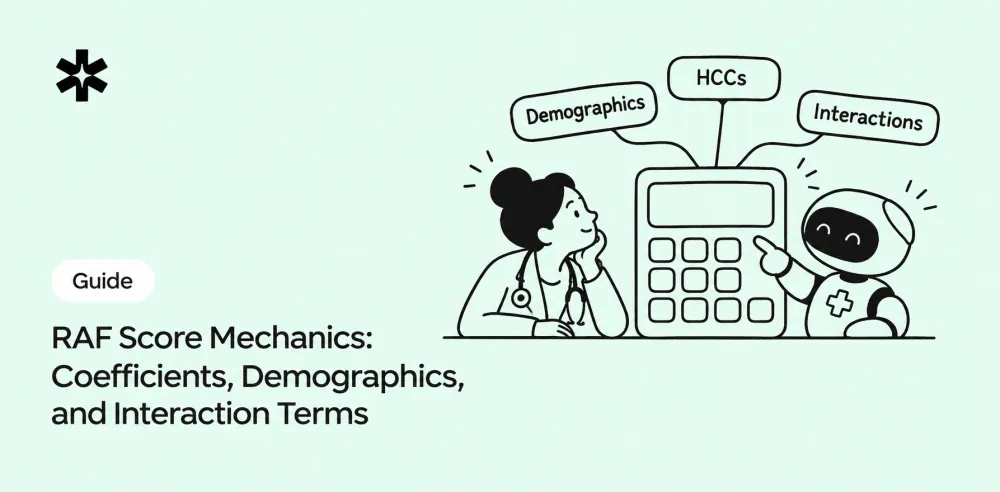
The arithmetic of how coefficients, demographics and interactions combine into a score is covered in RAF score mechanics: coefficients, demographics and interaction terms.
Who lost RAF
Three independent sources point the same way: the members and organizations with the highest V24 coding intensity lost the most.
MedPAC: coding intensity roughly halved
The Medicare Payment Advisory Commission's June 2026 analysis compared 2024 MA risk scores with those of similar Original Medicare beneficiaries. Under V24, MA scores were 18 percent higher. Under V28, they were 9 percent higher.
The reduction wasn't uniform. Organizations with low V24 coding intensity barely moved, with an average change of -0.3 points in the lowest band. Those with V24 coding intensity above 25 percent saw an average reduction of 23.3 points. MedPAC also estimated that paying 2024 entirely on V24 would have cost about $10 billion more.
Wakely: losses by population and plan profile
Wakely's analysis of its clients' data under the proposed V28 model found an average risk score impact of -3.7 percent, against CMS's national estimate of -3.12 percent at the time. The spread across segments was wide:
| Segment | Risk score change under V28 |
|---|---|
| Partial dual, aged | -8.9% |
| Full dual, aged | -6.7% |
| All dual eligible | -6.4% |
| Partial dual, disabled | -5.8% |
| Continuing community enrollees | -4.8% |
| Non-dual, disabled | -4.4% |
| Non-dual, aged | -4.0% |
| Full dual, disabled | -3.6% |
| Institutional | +3.2% |
| New enrollees | +16.0% |
By plan risk level, the pattern was sharper. Plans with average scores between 1.40 and 1.60 lost 13.0 percent, while plans with average scores between 0.60 and 0.70 gained 6.5 percent. By condition group, vascular and blood conditions were the most unfavorable, along with diabetes, metabolic and psychiatric conditions. Cancer, heart, lung and kidney conditions generally gained.
Regional results tracked the same logic. Puerto Rico fell 10.9 percent and the South 4.9 percent. The Northeast rose 1.1 percent.
These figures are from one actuarial firm's client base, on the proposed model rather than the final one. Treat them as direction and relative size, not a forecast for your plan.
SNP Alliance and Milliman: D-SNPs hit harder
A Milliman analysis for the SNP Alliance, released in March 2024, found that V28 was less favorable to dual-eligible special needs plans (D-SNPs) than to non-SNP MA plans at nearly every organization offering both. Results for institutional SNPs were mixed.
Why those groups lost it
The losses landed where V24 coding was most concentrated, which is what CMS designed V28 to do.
MedPAC found that the codes excluded from V28 cut total coding-rate differences between MA and Original Medicare by 30 percent. Those effects were concentrated in four areas: vascular disease, mental health, hematological disorders and immunity disorders. Just 14 excluded codes accounted for 23 percent of the total difference.
Dual-eligible members, high-RAF panels and plans with intensive in-home assessment programs tend to carry more of exactly those conditions, and coded them more often. When the codes stopped paying, those populations took the largest hit. Panels with low documented acuity, and new enrollees scored on demographics, had less to lose.
For a coding team, the read-through is uncomfortable but useful. If your organization lost substantially more than the national figure, the most likely explanation is a V24 coding profile weighted toward the excluded codes. That's worth confirming with data before assuming the model was unfair to your population.
How to measure your own V28 impact
National averages and actuarial client samples tell you the direction. They don't tell you why your own panel moved. A coding or analytics team can answer that with a four-step decomposition, using CMS's published model software and its ICD-10 to HCC mappings.
- Score the same population twice. Run one year of your submitted diagnoses through both the V24 and V28 models, with the same members and the same demographics. The difference is the pure model effect, separated from changes in your coding or enrollment.
- Split the change into causes. For each member, attribute the difference to one of four buckets: diagnoses that lost their payment HCC, constrained HCCs, coefficient changes on HCCs that still pay, and interaction or count-variable changes.
- Rank the lost codes by frequency and value. List the 20 ICD-10-CM codes that contributed most to the loss. In most panels a short list explains most of the drop, which matches MedPAC's finding that 14 excluded codes drove nearly a quarter of the national gap.
- Compare against the benchmarks above. If your loss is concentrated in vascular, psychiatric and hematological codes, you're seeing the intended V28 effect. If it's concentrated elsewhere, look at mapping errors, data submission gaps or demographic shifts first.
| Bucket | What it tells you | Action |
|---|---|---|
| Lost payment HCC | Model effect, not a coding problem | Keep coding when supported; drop RA-specific queries |
| Constrained HCC | Severity tier no longer pays | Keep specificity for audit consistency |
| Coefficient change | Same HCC, different weight | Update financial models, not coding |
| Interaction or count change | Member-level combinations moved | Check whether documentation of co-occurring conditions is complete |
The output is a short, defensible explanation for finance and leadership of why RAF moved, and a list of the few documentation areas where coding work still changes the result.
Where coding intensity still sits after V28
V28 didn't end coding intensity. MedPAC found that codes still included in the model account for 70 percent of the remaining MA coding-rate difference. Twenty-nine codes account for 52 percent. They're concentrated in four conditions:
| Condition | Why it matters now |
|---|---|
| Diabetes | Still a payment HCC; constrained coefficients, but high prevalence |
| Congestive heart failure | High-weight HCC family; named by OIG in its health risk assessment review |
| Chronic obstructive pulmonary disease | Common, chronic, recaptured annually |
| Morbid obesity | Depends on documented BMI and clinical support |
These are the conditions where documentation will be tested hardest, by RADV reviewers, by OIG and by plan internal audit. OIG's 2024 review of health risk assessments named diabetes and congestive heart failure among the conditions where a small number of companies drove disproportionate payments.
The practical guidance for each is the same: document the condition at a qualifying encounter each year, with evidence it was evaluated or managed, at the specificity the note actually supports.
What coding teams should do now
Re-baseline on V28 only. Any dashboard, coder scorecard or vendor report still showing V24 HCCs or blended RAF is measuring a model that no longer pays. Rebuild the baseline on 2026 V28 scores.
Stop chasing codes that don't pay, but keep coding them. Retire risk adjustment queries aimed at codes with no V28 payment HCC. Don't stop assigning those codes when the record supports them. Complete coding feeds quality reporting and the next recalibration.
Concentrate review on the four high-intensity conditions. Diabetes, CHF, COPD and morbid obesity are where both the remaining payment and the remaining audit attention sit. Sample them first in internal audit.
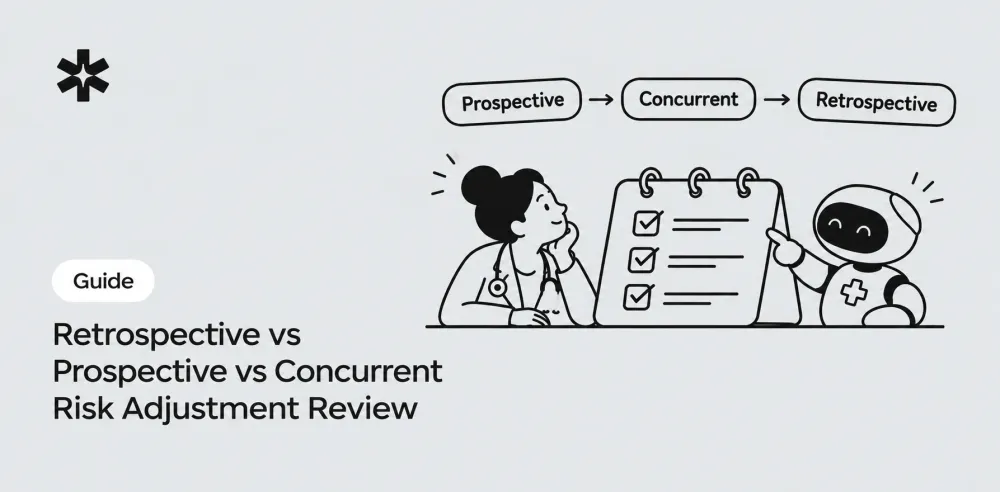
Account for 2027 submission rules. From 2027, diagnoses from unlinked chart reviews and audio-only services (modifier 93 or FQ) no longer count toward risk scores for non-PACE plans. A V28 recapture strategy built on retrospective chart review needs rework. The trade-offs are in retrospective vs prospective vs concurrent risk adjustment review.
Expect recalibration. In the CY 2027 Advance Notice, CMS proposed recalibrating V28 on 2023 diagnoses and 2024 expenditures. The final announcement deferred it. Coefficients will move again when it returns, and the populations that lost under V28 shouldn't assume the next version restores what they lost.
FAQ
Is V28 at 100 percent for 2026?
Yes. For payment year 2026, CMS calculates all non-PACE Medicare Advantage risk scores with the 2024 CMS-HCC model (V28). The CY 2027 Rate Announcement keeps the same model for 2027. PACE organizations still use a blend.
How many codes did V28 remove?
About 2,236 ICD-10-CM codes that mapped to a payment HCC under V24 don't map to one under V28. CMS attributes 75 of them to discretionary coding variation. The rest came from reclassifying and recalibrating the model on ICD-10.
Which members lost the most RAF under V28?
Dual-eligible members, especially partial dual aged, and members of high-RAF plans saw the largest reductions in Wakely's analysis. MedPAC found the largest drops at organizations that had the highest coding intensity under V24. Institutional members and new enrollees generally gained.
Did V28 lower Medicare Advantage coding intensity?
Yes. MedPAC estimated that 2024 MA risk scores were 18 percent above comparable Original Medicare beneficiaries under V24, and 9 percent above under V28. Most of the remaining gap is in diabetes, congestive heart failure, COPD and morbid obesity.
This article is general education on risk adjustment coding. It isn't a coding determination for any specific patient or encounter.